A National Roadmap for Grid-Interactive Efficient Buildings

PREPARED BY
Read the Full Report

Since Thomas Edison threw the switch at the world's first commercial power plant in 1882 to power 400 lamps, buildings have consumed the lion's share of U.S. electricity, and today account for three-fourths of the total and even more at peak. Yet, buildings consume power indifferent to grid conditions, blind to the high costs and threats to reliability posed by high peak demand and grid stress; inflexible to opportunities offered by variable, carbon-free renewable power sources; and senselessly missing the smart and connected technology revolution.

Grid-interactive efficient buildings (GEBs) can remake buildings into a major new clean and flexible energy resource. GEBs combine energy efficiency and demand flexibility with smart technologies and communications to inexpensively deliver greater affordability, comfort, productivity and high performance to America's homes and commercial buildings.

David Nemtzow

Director, DOE Building Technologies Office (BTO)

DOE'S NATIONAL GOAL FOR GEBs

Triple the energy efficiency and demand flexibility of the buildings sector by 2030 relative to 2020 levels.

Overview of The Roadmap

  • Buildings account for over 70% of U.S. electricity consumption and power sector CO2 emissions.
  • By combining energy efficiency and demand flexibility, grid-interactive efficient buildings (GEBs) can remake buildings into a clean and flexible resource.
  • Achievable national adoption of GEBs could save hundreds of billions of dollars in power system costs, reduce carbon emissions, and relieve stress on the grid.
  • DOE has established a goal of tripling energy efficiency and demand flexibility in residential and commercial buildings by 2030, relative to 2020 levels.
  • To achieve this goal, this Roadmap includes 14 recommendations in the following areas:
    • Advancing GEBs through R&D and data
    • Enhancing and communicating the value proposition of GEBs
    • Empowering users and operators by developing new tools and training workers
    • Using federal, state and local government action to support GEB deployment

The power system value of GEBs was quantified using a sophisticated suite of modeling tools developed by DOE, LBNL, NREL, and Brattle

Define GEB measures to represent the best commercially available technology for major building end-uses.
LBNL/NREL analysis
Simulate GEB technology performance for thousands of individual buildings on an 8,760 hourly basis.
NREL's ResStock & DOE's Commercial Prototype models
Scale building characteristics by region, to align with the size, mix, and weather characteristics of 22 U.S. regions.
BTO's Scout model
Adjust estimates to reflect achievable adoption rates and stock turnover, based on review of regional and national EE and DR studies.
Brattle analysis
Develop forecasts of system costs through 2030, including generation capacity, energy, ancillary services, and transmission capacity.
NREL's Cambium model
Evaluate ability of GEB measures to avoid forecasted system costs, including dynamic dispatch of DF measures.
Brattle's LoadFlex model
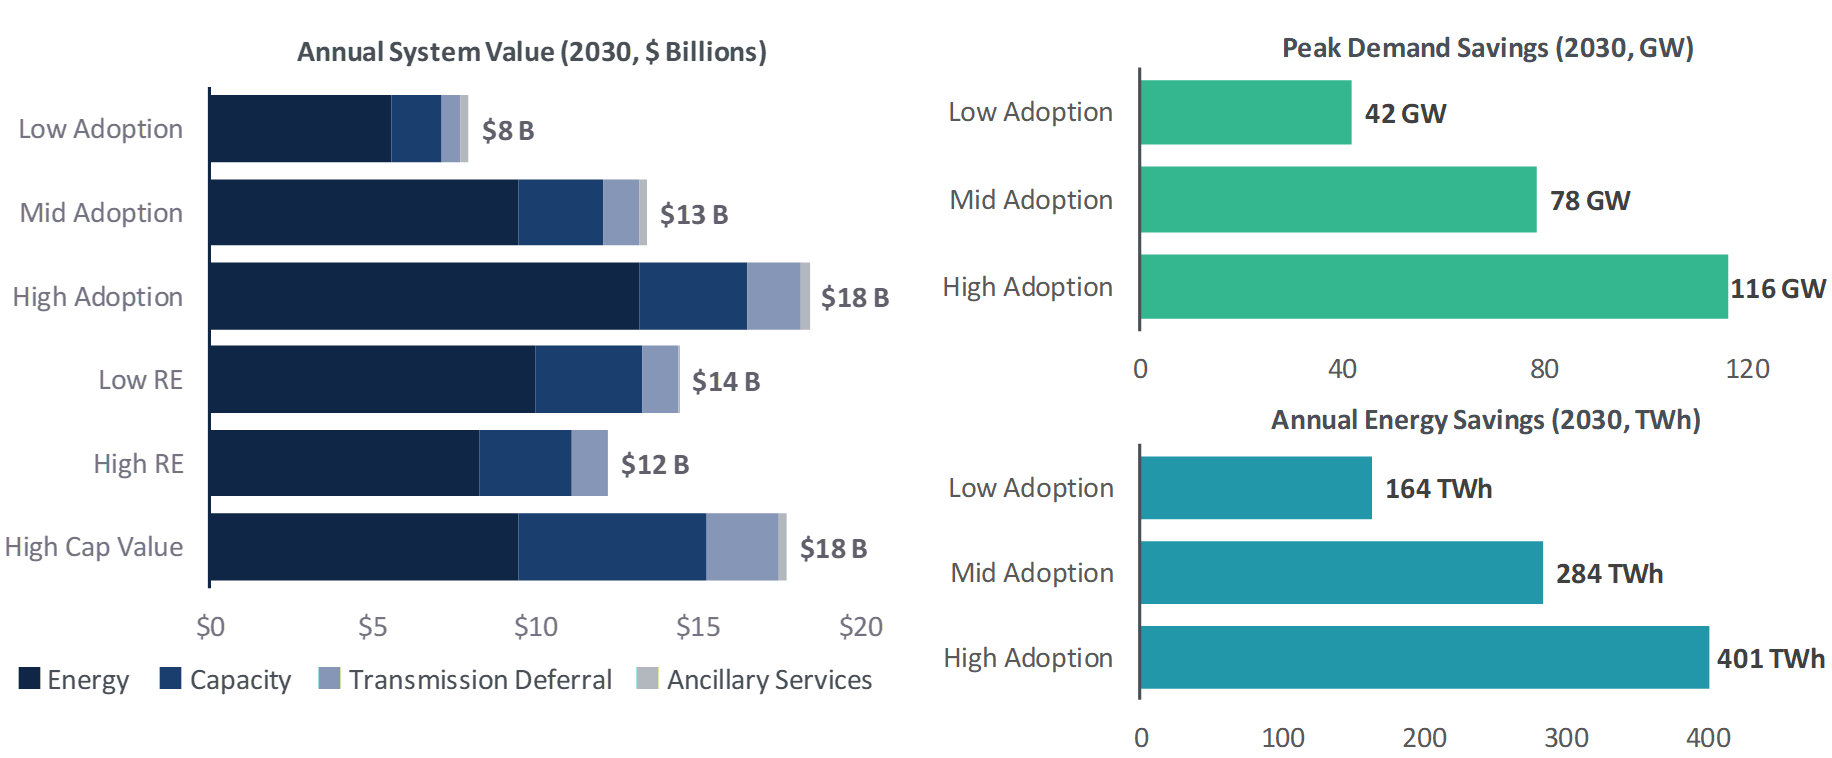
FIGURE 1: THE U.S. POWER SYSTEM VALUE OF PEAK DEMAND AND ENERGY SAVINGS DUE TO ACHIEVABLE LEVELS OF GEB ADOPTION

Notes: All in 2019 dollars. Peak demand savings are computed as the sum of impacts during each region's coincident peak hour. $100 - $200 billion reflects the NPV at a social discount rate of 4% nominal (2% real).

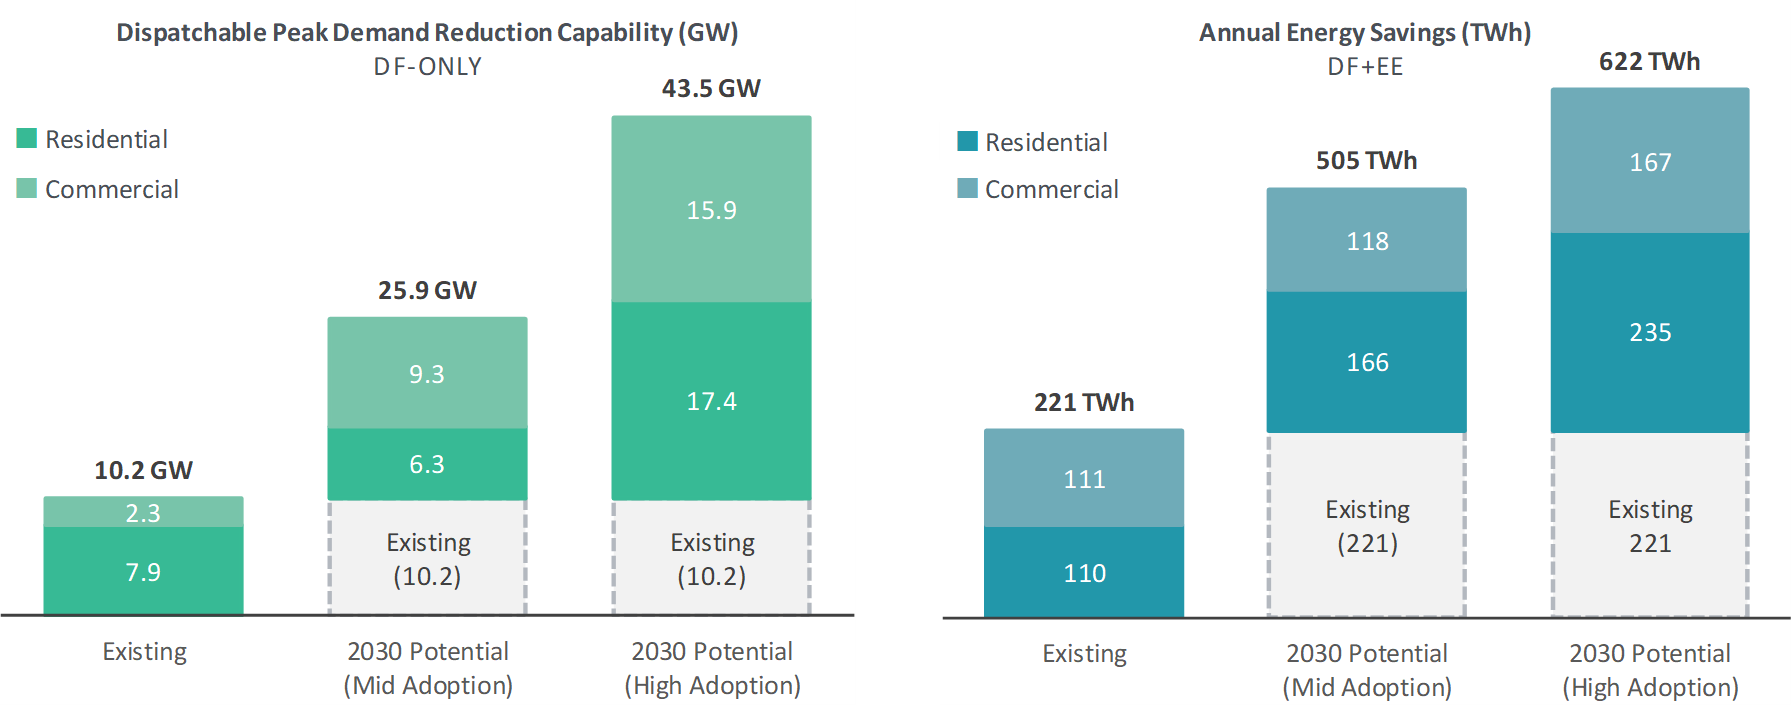
FIGURE 2: PUTTING THE GEB POTENTIAL ESTIMATES INTO HISTORICAL CONTEXT

Notes: 2030 peak reduction capability estimates are for a case with only demand flexibility deployment (i.e., no EE). Peak demand reductions are computed as the sum of impacts during each region's coincident peak hour. 2030 annual energy savings are for the DF+EE cases described in the Analysis Cases described in the report, in which both DF and EE measures are adopted. “Existing” covers EE capability developed between 2010 and 2019. “2030 Potential” covers modeled savings capability that could be developed between 2021 and 2030 and is incremental to existing EE.

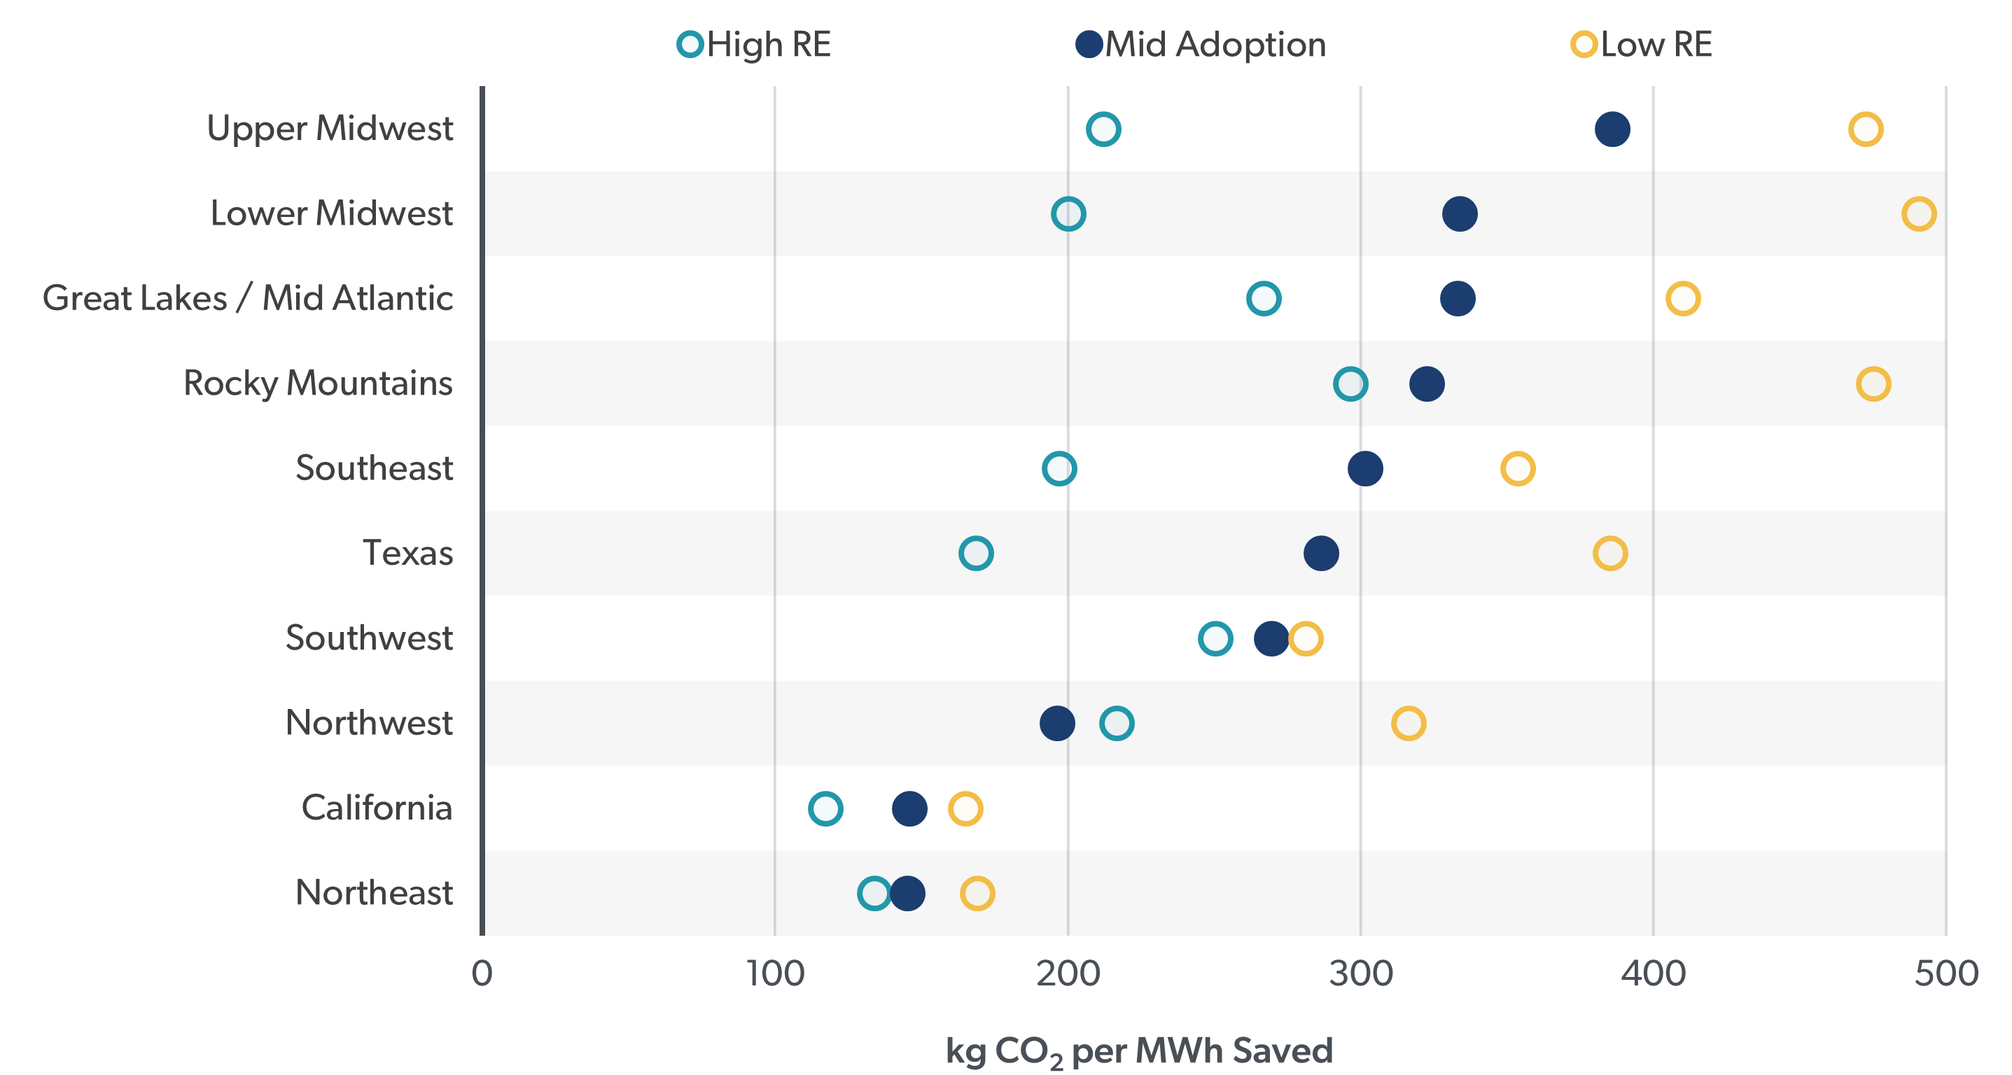
FIGURE 3: CO2 EMISSIONS REDUCTION PER MWH OF ENERGY SAVINGS FROM GEBS (2030)
Figure 1
Figure 2
Figure 3

Buildings account for more than 70% of U.S. electricity use, and a comparable share of power sector CO2 emissions. Improving the way electricity is consumed and reducing the overall amount of electricity consumed in buildings would significantly reduce energy costs to consumers and facilitate the transition to a decarbonized economy.

Download this Roadmap to learn about the 14 recommendations for addressing the top barriers to GEB adoption and deployment.

Read the Full Report

For more information, please reach out to the study authors.

AUTHORS

LAWRENCE BERKELEY
NATIONAL LABORATORY

Andrew Satchwell

Mary Ann Piette

Aditya Khandekar

Jessica Granderson

Natalie Mims Frick

THE BRATTLE GROUP

Ryan Hledik

Ahmad Faruqui

Long Lam

Stephanie Ross

Jesse Cohen

ENERGY SOLUTIONS

Kitty Wang

Daniela Urigwe

WEDGEMERE GROUP

Dan Delurey

U.S. DEPARTMENT
OF ENERGY

Monica Neukomm

David Nemtzow

WEDGEMERE GROUP

Dan Delurey